

数据可视化-艺术字
数据可视化之艺术字
Python绘制-艺术字
matplotlib
还是使用我们熟悉的 matplotlib 来绘制。
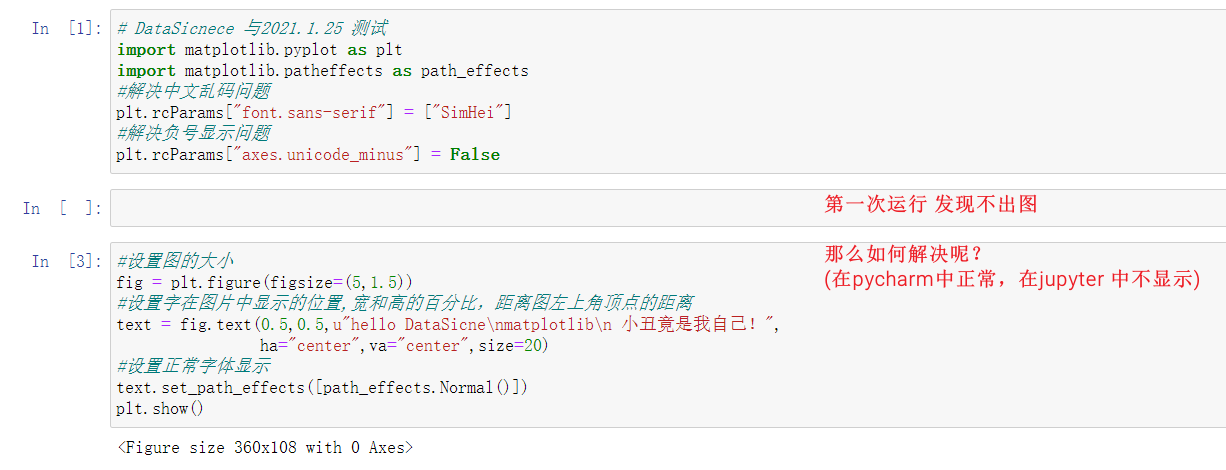
发现不出图 解决方案
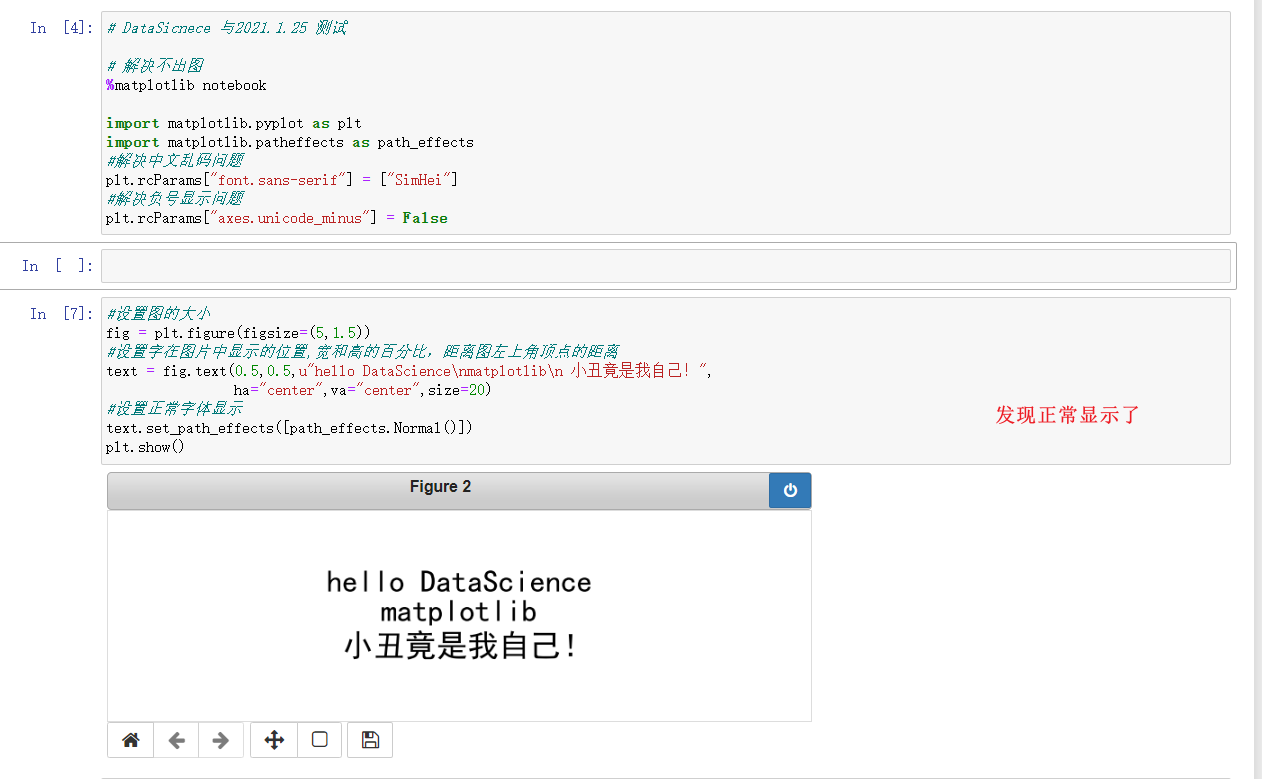
matplotlib画图在jupyter notebook中不显示
需要注意的是:每次单独绘制完成之后 需要点击关闭,否则后续会增加进来的。
- 开头加%matplotlib notebook
- 确保fig,ax = plt.subplots()与plt.show在一个cell执行,不能放到两个cell里
1、绘制文字
# DataSicnece 与2021.1.25 测试

# 解决不出图
%matplotlib notebook

import matplotlib.pyplot as plt
import matplotlib.patheffects as path_effects
#解决中文乱码问题
plt.rcParams["font.sans-serif"] = ["SimHei"]
#解决负号显示问题
plt.rcParams["axes.unicode_minus"] = False


#设置图的大小
fig = plt.figure(figsize=(5,1.5))
#设置字在图片中显示的位置,宽和高的百分比,距离图左上角顶点的距离
text = fig.text(0.5,0.5,u"hello DataScience\nmatplotlib\n 小丑竟是我自己!",
                ha="center",va="center",size=20)
#设置正常字体显示
text.set_path_effects([path_effects.Normal()])
plt.show()
2、绘制阴影效果
#设置字体带有阴影
text = plt.text(0.5,0.5,"小丑竟是我自己",
                path_effects=[path_effects.withSimplePatchShadow()])
#通过设置一个列表的path_effects,来间隔显示不同的效果
plt.plot([0,4,2,6],linewidth=5,color="green",
         path_effects=[path_effects.SimpleLineShadow(),path_effects.Normal()])
plt.show()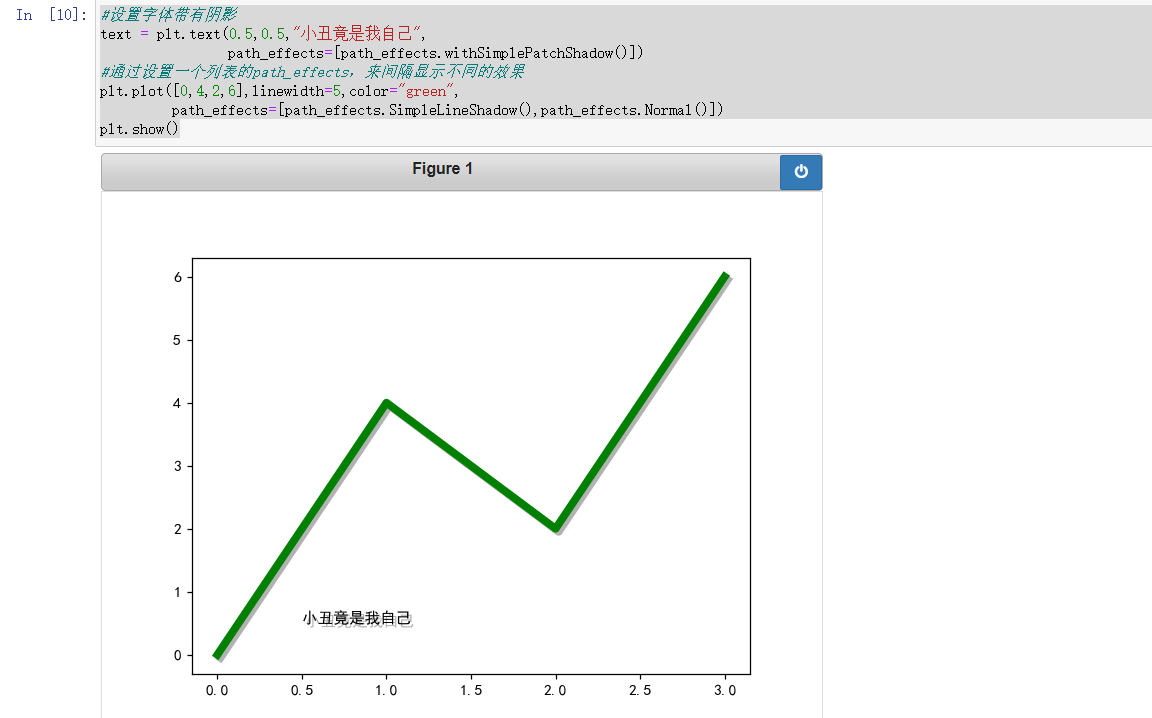
3、艺术字I
fig = plt.figure(figsize=(5,2))
text = fig.text(0.5,0.5,"小丑竟是我自己",
                color="white",ha="center",va="center",size=30)
text.set_path_effects([path_effects.Stroke(linewidth=5,foreground="blue"),path_effects.Normal()])
plt.show()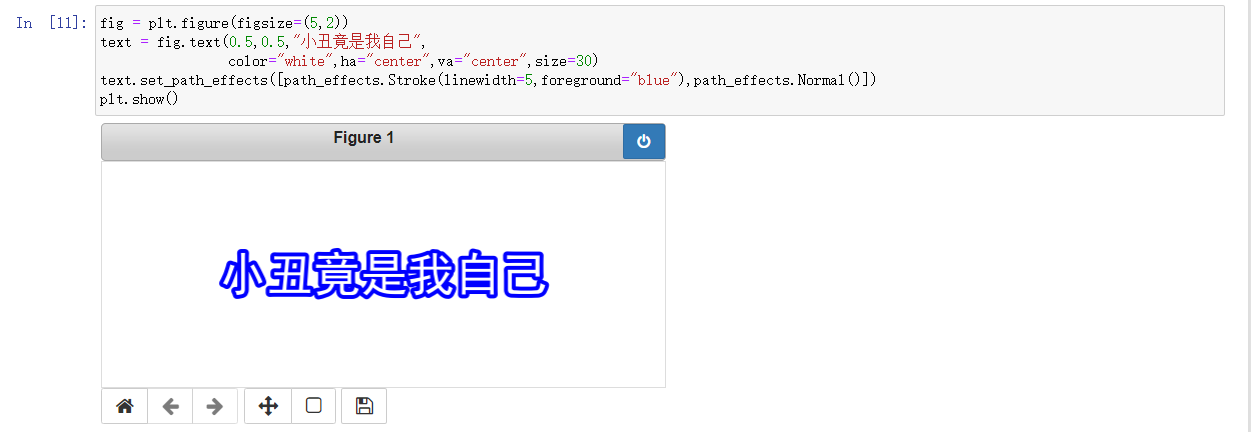
4、艺术字II
fig = plt.figure(figsize=(10,2))
t = fig.text(0.02,0.5,"小丑竟是我自己",fontsize=75,weight=1000,va="center")
t.set_path_effects([
        path_effects.PathPatchEffect(offset=(4,-4),hatch="***",facecolor="grey"),
        path_effects.PathPatchEffect(edgecolor="white",linewidth=1.1,facecolor="blue")
 ])
plt.show()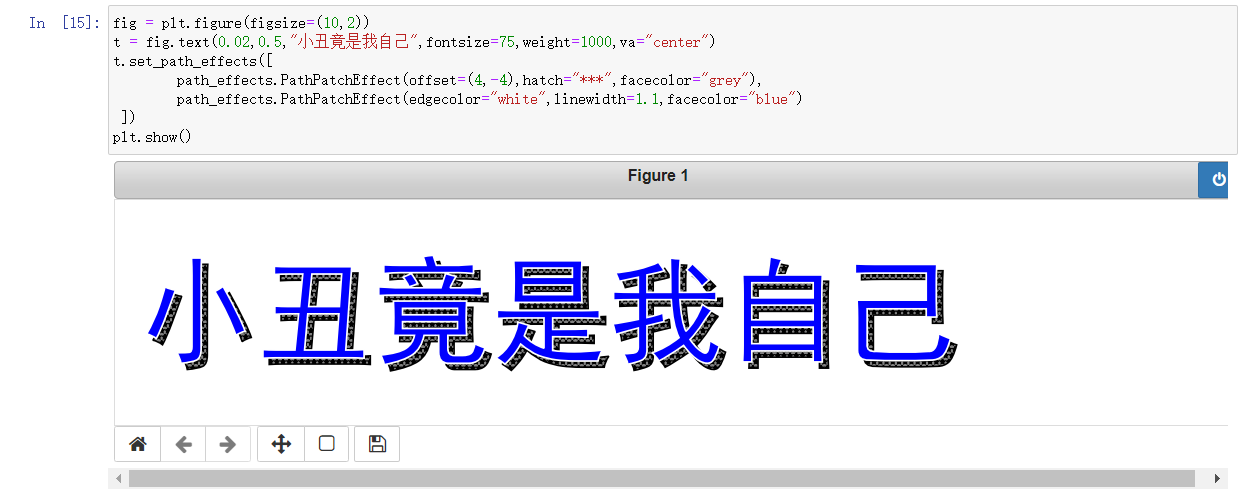


